This is the latest in a series of reports, issued on a roughly annual basis by Global Financial Integrity (GFI), which provides country-level estimates of the illicit flows of money into and out of 148 developing and emerging market nations as a result of their trade in goods with advanced economies, as classified by the International Monetary Fund. Such flows—hereafter referred to as illicit financial flows (IFFs)—are estimated over the years from 2006 to 2015, the most recent ten year period for which comprehensive data are available. In addition to updating the estimated IFFs GFI has presented in the past, this report widens the scope of its research and uses a more detailed database published by the United Nations (UN) along with updated measures from the International Monetary Fund (IMF) data it has used previously. This report presents estimates of IFFs based on both data sets. GFI defines IFFs as “money that is illegally earned, used or moved and which crosses an international border.” Currently, the World Bank, IMF, UN, and the OECD use a similar definition.
This study underscores the point that trade-related IFFs appear to be both significant and persistent features of developing country trade with advanced economies. As such, trade misinvoicing remains an obstacle to achieving sustainable and equitable growth in the developing world.
Highlights of our research for the year 2015 using the Direction of Trade Statistics (DOTS) dataset from the IMF show that:
- The top quintile (30) of countries, ranked by dollar value of illicit outflows, includes resource rich countries such as South Africa ($10.2 billion) and Nigeria ($8.3) but also European countries including Turkey ($8.4 billion), Hungary ($6.5 billion) and Poland ($3.1 billion) as well as Latin American nations Mexico ($42.9 billion), Brazil ($12.2 billion), Colombia ($7.4 billion) and Chile ($4.1 billion). Asian states in the top 30 countries of this category include Malaysia ($33.7 billion), India ($9.8 billion), Bangladesh ($5.9 billion) and the Philippines ($5.1 billion).
- The top quintile (30) of countries, ranked by illicit outflows as a percentage of total trade with advanced economies, produces an entirely different group of countries including Mozambique (48.1%), Malawi (44.1%), Zambia (43%), Honduras (39.7%), Namibia (38.7%) and Myanmar (30.8%).
- The list of top 30 countries ranked by dollar value of illicit inflows (Note: illicit inflows are a type of resource curse in that a) their origin is unknown, b) inflows are invisible to governments, c) they are not taxed, and d) they often times fuel illegal activities such as drug trafficking) include a regionally diverse group including Vietnam ($22.5 billion), Thailand ($20.9 billion), and Indonesia ($15.4 billion) as well as Latin American nations Panama ($18.3 billion) and Argentina ($4.8 billion). Additional countries include Kazakhstan ($16.5 billion), Belarus ($6.1 billion) and Morocco ($3.9 billion).
For DOTS-based estimates of illicit flows—in dollars and as a percentage of total trade with advanced economies—for countries which do not appear above see: Appendix Table III-1. DOTS-based Estimates of Potential Trade Misinvoicing by Country, 2015.
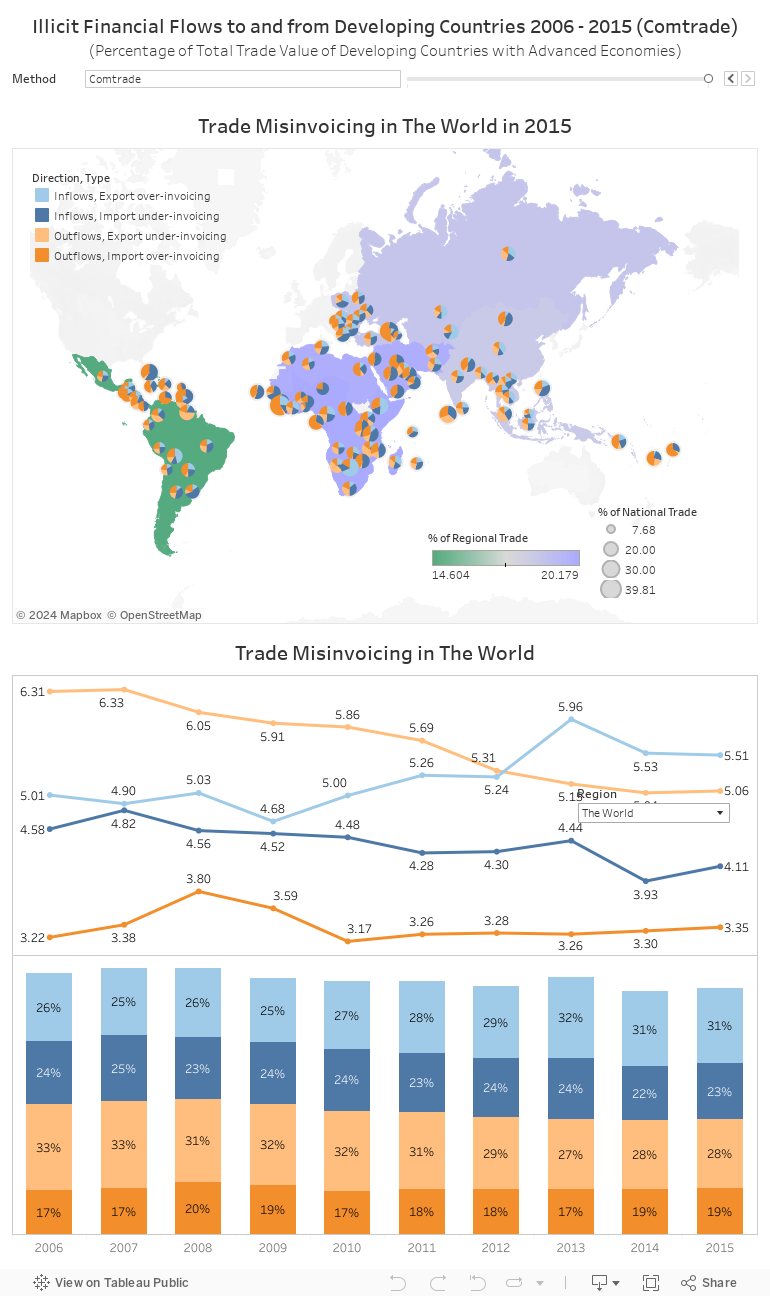
Highlights of our research for 2015 using the Comtrade dataset from the United Nations show that:
- The top quintile (30) of countries, ranked by dollar value of illicit outflows, includes European nations Hungary ($7.6 billion), Romania ($5.1 billion) and Bulgaria ( $1.8 billion), as well as Latin American countries Mexico ($31.5 billion), Brazil ($12 billion), Argentina ($2.7 billion) and Peru ($2.1 billion). Asian nations included in the top 30 countries of this category include Malaysia ($22.9 billion), Thailand ($16 billion), Indonesia ($9.6 billion) and Vietnam ($9.1 billion). African nations among the top 30 include South Africa ($5.9 billion), Algeria ($4.1 billion), and Tunisia ($1.8 billion).
- The top quintile (30) of countries, ranked by illicit outflows as a percentage of total trade with advanced economies, produces a different set of countries including Uganda (14.7%), Rwanda (13.7%), and Namibia (13.6%), as well as Costa Rica (12.5%), Colombia (12.1%) and Guatemala (11.9%).
- The list of top 30 countries ranked by dollar value of illicit inflows include a regionally diverse group including Poland ($32.3 billion), Romania ($6.8 billion), Indonesia ($10.1 billion) Bangladesh ($2.8 billion), Chile ($3.2 billion), Colombia ($2.9 billion), Morocco ($2.7 billion), and Tunisia $2.3 billion).
For Comtrade-based estimates of illicit flows—in dollars and as a percentage of total trade with advanced economies—for countries which do not appear above see: Appendix Table III-2. Comtrade-based Estimates of Potential Trade Misinvoicing by Country, 2015.