
The Methodology behind Illicit Financial Flows from Developing Countries: 2004-2013
By Joseph Spanjers, December 15, 2015
Last week GFI released its latest annual update on illicit financial flows from developing countries—Illicit Financial Flows from Developing Countries: 2004-2013. In this report, trade misinvoicing outflows were revised upwards for a number of countries, as compared to the 2014 annual update. This reflects a refinement in how we calculated our estimates for 37 countries, including major emerging economies like Mexico, South Africa, and Turkey. These countries join 19 others for which we were able to use more detailed data to capture how much money flowed out illicitly. As a result, our estimate for 2013 was a total outflow of a staggering US$1.1 trillion—and the world actually crossed this trillion mark in 2011.
Why does this matter? The increased precision more accurately reflects the level of trade misinvoicing in these countries, and in turn, the developing world as a whole. Though our figures remain estimations that cannot cover every instance of misinvoicing or illicit flows, they demonstrate well the scale of the problem.
The revised calculation is accomplished by comparing the country’s reported bilateral trade with individual advanced economies (and then adjusting that to a global figure), as opposed to a comparison with the world as a whole. This adjustment mitigates an aggregation problem that occurs when using the world as a trade partner.
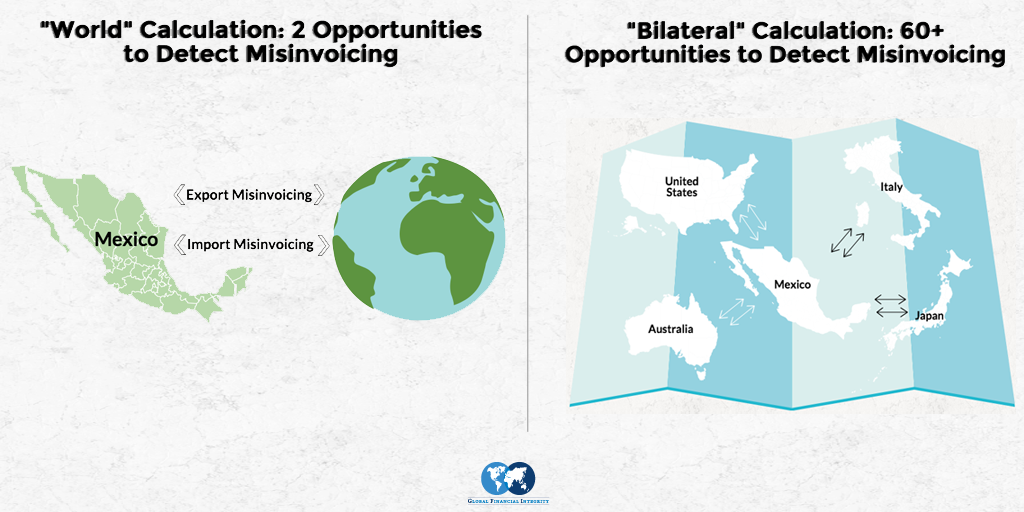
This problem is as follows: If, for example, there were X outflows due to import over-invoicing with Germany, a higher level of inflows–2X–due to import under-invoicing with the United Kingdom would have completely offset the outflows to Germany, and then some. This situation would register zero illicit outflows due to import over-invoicing in that year, though import over-invoicing did indeed occur with Germany (and likely many other countries). Under the estimation method that uses individual advanced economies as partners (as opposed to a world aggregate group), this statistical cancellation of outflows does not occur, leading to a more precise and typically higher estimate. Bilateral data gives us over 60 opportunities to detect illicit outflows, while world aggregate data gives us only two.
Typically is the operative word. Though Turkey’s trade misinvoicing estimates rose 282.9 percent compared to the 2014 annual update (from an average of US$3.7 billion over 2004-2012 to US$14.2 billion over the same time period), the increase in South Africa was only 53.5 percent, and in Mexico, trade misinvoicing estimates actually dropped 5.9 percent. Although the vast majority of countries experienced much larger percentage increases than even Turkey, the cases of Mexico, Panama (61.1 percent decrease), and Costa Rica (1.2 percent increase) underscore that this refinement in the methodology is just that—a change that creates more accurate trade misinvoicing numbers, not merely numbers that are consistently significantly higher.
An accurate measure of illicit outflows is an important step towards curtailing them. If you don’t know how much you’re losing and where (e.g. balance of payments leakages vs. trade misinvoicing), how can a state know where to focus its efforts and by how much those efforts are paying off? Governments that are not collecting or reporting bilateral trade data with the IMF are thus at a disadvantage. When you see a zero in our appendix tables for a country’s trade misinvoicing outflows in a given year, that means no illicit outflows were detected—it does not mean there were no illicit outflows. For example, the “zero” illicit outflows from Egypt, Mozambique, Pakistan, Nepal, and Zimbabwe in seemingly random years in this study reflect not a lack of outflows, but the impossibility of detecting some illicit outflows using the world as a trade partner.
By delving into more detail on trade flows thanks to access to bilateral data, we’ve gotten a more accurate picture of these 37 countries’ illicit outflows. In making this more nuanced calculation of trade misinvoicing for more countries than any previous GFI study, this report represents our most robust and accurate picture of measurable illicit flows to date.
Note: A full list of newly included bilateral reporters, and their relative change in trade misinvoicing outflows relative to the 2014 annual update, is available in Appendix Table 7 (page 46) of Illicit Financial Flows from Developing Countries: 2004-2013. Interested readers may also wish to refer to the methodological appendix on pages 47-50.