
GFTrade
 Trade Misinvoicing Risk Assessment
What is it?
GFTrade is a proprietary risk assessment application that enables customs officials and financial institutions to determine if goods are priced outside typical ranges for comparable products by providing officials with real-time price comparisons for goods in the port, using price ranges for a product traded between the same two trading partners throughout the previous year, based on global trade information. The comparisons enable officials to determine pricing anomalies and if further investigation is warranted. The system is fed by the most recent official trade data from 63 countries including China, the United States, EU, Japan and many others, and provides the ability to search for goods values based on thousands of Harmonized System (HS) codes. GFTrade is an essential tool to assist governments in maximizing domestic resource mobilization and tackling trade misinvoicing.
For customs departments, central banks and FIUs:
- Read the GFTrade Brochure For Customs Departments, Central Banks And FIUs in English
- Lisez la Brochure GFTrade Pour Les Services Douaniers, Les Banques Centrales et les CRF en Français
- Información sobre GFTrade para Aduanas, Bancos Centrales y Unidades de Inteligencia Financiera en Español
For trade finance institutions:
By fraudulently manipulating the price, quantity, or quality of a good or service on an invoice submitted to customs, illicit actors can easily and quickly shift substantial sums of money across international borders. Trade misinvoicing occurs in all countries and for various reasons including to evade tax and/or customs duties, to launder the proceeds of crime, to circumvent currency controls, and to hide profits offshore, among others. In developed nations, revenue losses due to trade misinvoicing and the ramifications of trade-based money laundering—including its possible connection to terrorist financing—is significant, while in developing and emerging market nations trade misinvoicing can drastically undermine domestic resource mobilization efforts which weakens a government’s ability to build the economy and alleviate poverty. Given that rates of tax collection in developing nations tend to be well below those seen in developed nations, the loss of revenue due to trade misinvoicing has a corrosive impact on development.
How does it work?
An example of how the system works is seen in the screen shot below. In this hypothetical case, a customs official in Durban, South Africa can compare the price of hydraulic machinery imported from the United States against a range of pricing for the same product imported from the U.S. over the past 12 months, based on information in the database. To begin, the official will input an HS Code for a specific product (i.e. hydraulic machinery – 842129) and select from the search results the commodity that most closely matches the information on the shipment’s customs document. Having selected a commodity, the user will be able to compare the range of previous pricing from a specific country against a live trade invoice. To do so, a customs official will input the total value of the shipment he/she is processing and GFTrade will return a visual comparison of the unit price of that shipment with the average price for the previous 12 months. For the purposes of this hypothetical example we have inputted a unit price of $12 per unit. This is visualized as follows:
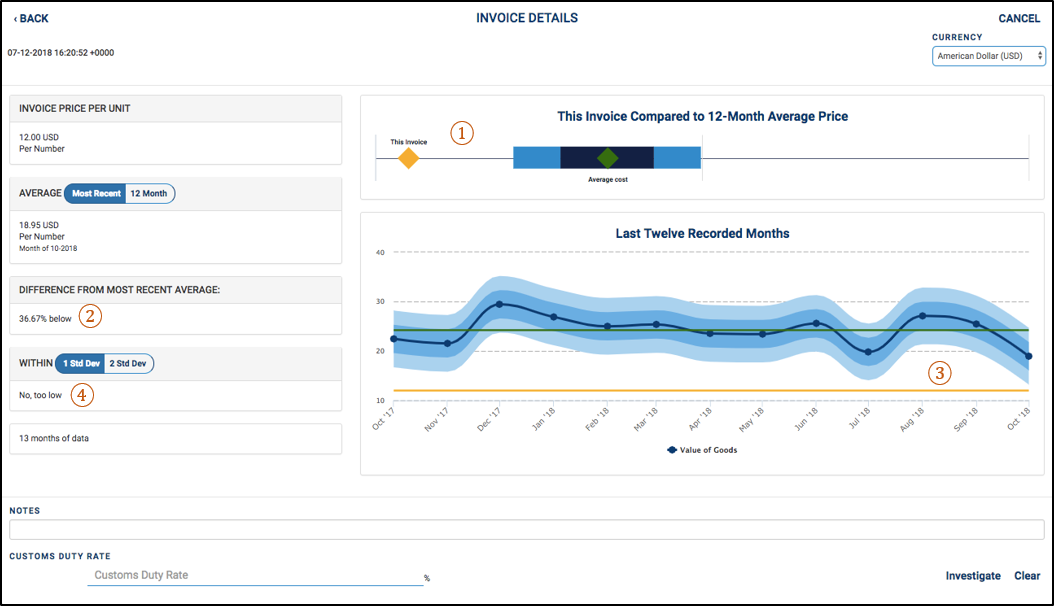
Figure 1: Price comparison visualization
The figure above provides four ways to determine if a product in the port is priced within a typical range. The first way to make a determination is seen at the top of the screen where the yellow diamond indicating “this invoice” is compared to current average pricing using a plot line. The greater the distance to the left of the diamond representing the “average cost” shows the degree of under-pricing and the greater the distance to the right of that point indicates the degree of overpricing. In this case, the yellow diamond indicating “this invoice” is well to the left of the 12-month average price (green diamond) thereby indicating that this invoice price is lower than the usual range of prices for this product. The second way to make this determination is seen to the left of the screen under the heading “Difference With Most Recent Average” which notes that the current invoice value is “36.67% below” most recent monthly average price ($18.95).
The third way to indicate invoice pricing variations from the norm is represented by a solid yellow horizontal line which compares to the floating monthly average price for the previous 12 months as well as to the 12-month average price ($24.20) represented by the solid green horizontal line. The gap between the solid yellow horizontal line and the solid green horizontal line provides a clear indication the invoice is below average pricing. This is seen again in the fourth indicator (on the left margin), which refers to one and two standard deviations (both high and low) from the most recent average monthly price. The standard deviations for the previous 12 months are represented in the diagram by the two lighter blue bands. It should be noted that the standard deviations can be used as the outer range of acceptable risk whether it be above or below the average price but these are subjective distinctions and for customs departments to determine its risk sensitivity.
After analyzing the information above, the user may then proceed to either clear the shipment or flag (bottom right corner of the screen shot) it for additional price verification and investigation. It is highly recommended that all users input the customs duty rate (bottom left corner) for a particular commodity prior to flagging a transaction, as this data can provide the system with information that can subsequently be used to calculate differences in revenue collected from flagged transactions.
Who can use it?
GFTrade can be used by:
- Customs Departments – Determine if imports are priced within a normal range (while the goods are still in the port) to assess if the correct amount of duties are being paid.
- Central Banks – Determine if exports are priced within a normal range (before goods are exported) to determine if the proper amount of hard currency is entering the country.
- Transfer Pricing Units – The tool allows for an analysis of pricing for goods that have been traded between related parties to determine if arms-length prices were used.
- Law & Revenue Enforcement/Investigation Units – The database assists in determining if trade/customs fraud, TBML, VAT fraud or income tax evasion might have occurred based on unit price comparisons.
- Financial Institutions – GFTrade can help trade finance and compliance teams conduct due diligence by using the information on letters of credit for international commercial transactions.
What kind of data is included?
GFTrade incorporates official data from 63 countries, including eight of the world’s 10 largest trade economies (by volume): China, United States, Germany, Japan, France, United Kingdom, the Netherlands, and Italy. The database is updated monthly with official government statistics from all 63 countries. These updates occur automatically with no technical requirements by the end-user. To ensure maximum accuracy in average pricing, goods in are sorted by the global standard 6-digit HS codes with ability to use 8-, 9-, and 10-digit HS codes as well.
What are the benefits?
GFTrade provides the following benefits to users:
- Accuracy: Real-time pricing on tens of thousands of products from 43 of the world’s top trading nations.
- Efficiency: The system enables customs officials to quickly clear low-risk transactions and place greater focus on commodities presenting an indication of misinvoicing.
- Speed: Results provided instantaneously – won’t delay movement of goods.
- Consistency: Product pricing information updated monthly.
- Ease of training & use: Price inquiries take just seconds to enter and price comparisons displayed five ways.
- Security: Password protection and server firewalls prevent data leakages.
- Value: Very high return on investment.
For more information or a demonstration of GFTrade, contact Lionel Bassega at lbassega@gfintegrity.org